> ## Documentation Index
> Fetch the complete documentation index at: https://lightdash-mintlify-9d6f9427.mintlify.site/llms.txt
> Use this file to discover all available pages before exploring further.
# Line chart
> Use line charts to show changes in a number over a short or long period of time.
 Line charts are used to show changes in a number over a short or long period of time.
They're a good option when:
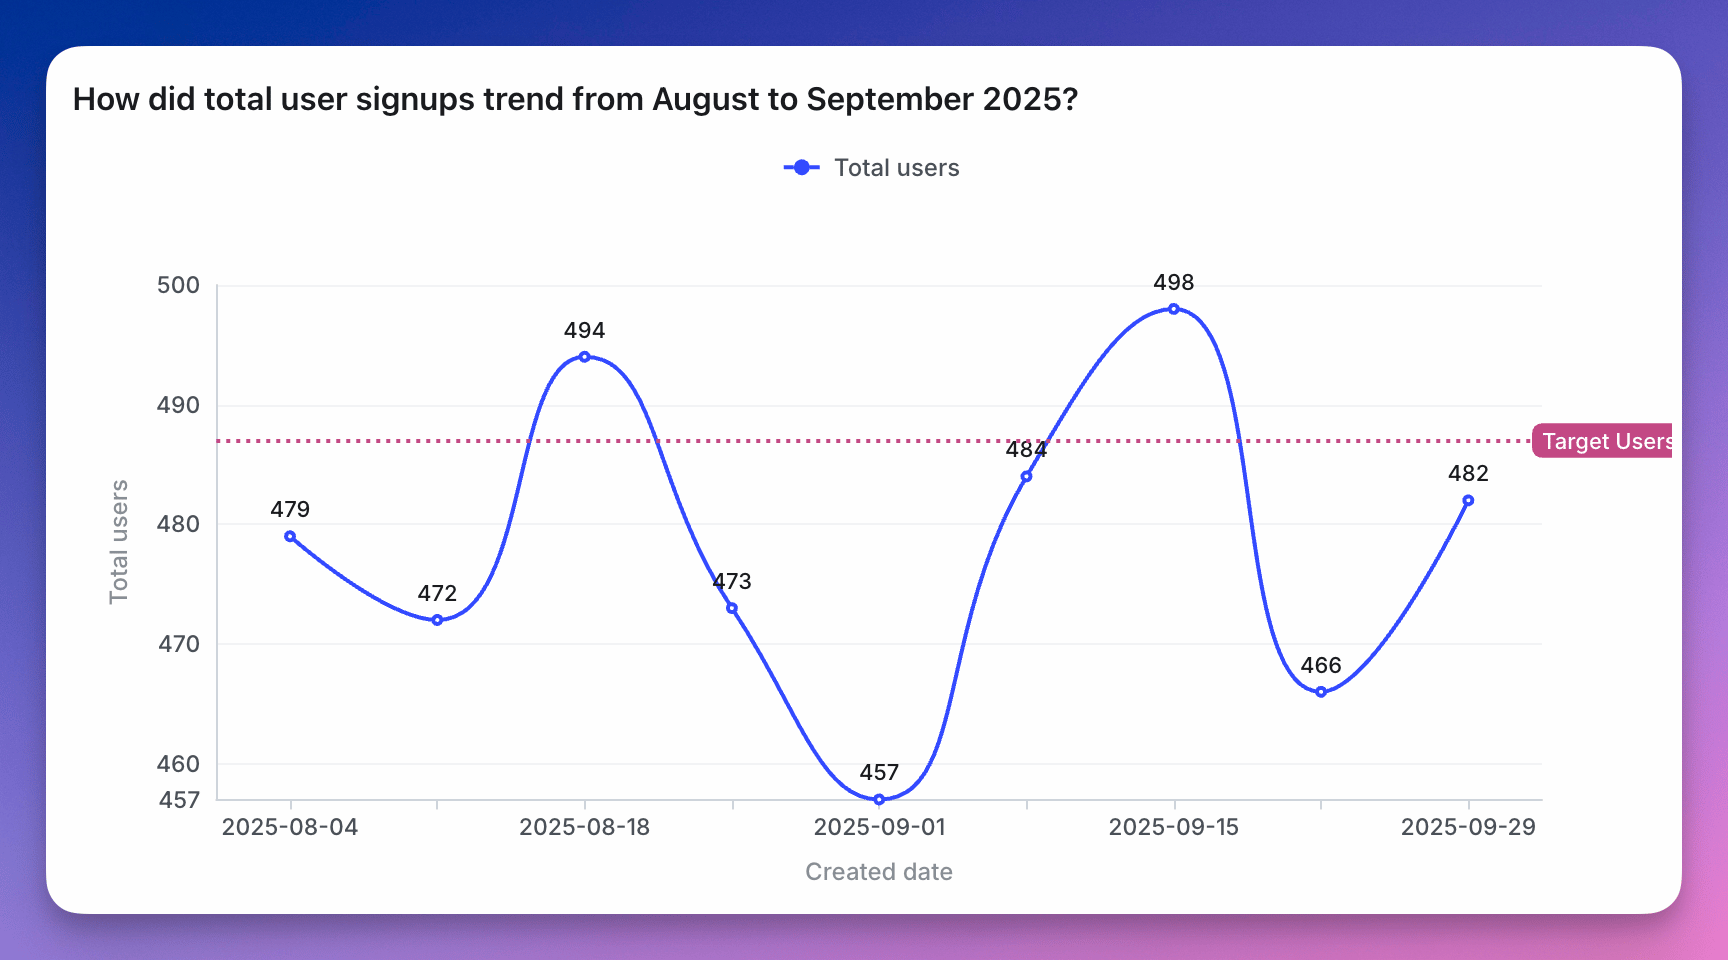
* **you have small changes between your values**. The y-axis of a line chart doesn't need to start at zero. This means that your y-axis can be stretched to show the tiny differences.
* **you have lots of x-axis values**. In this case, line charts are better to use than bar charts.
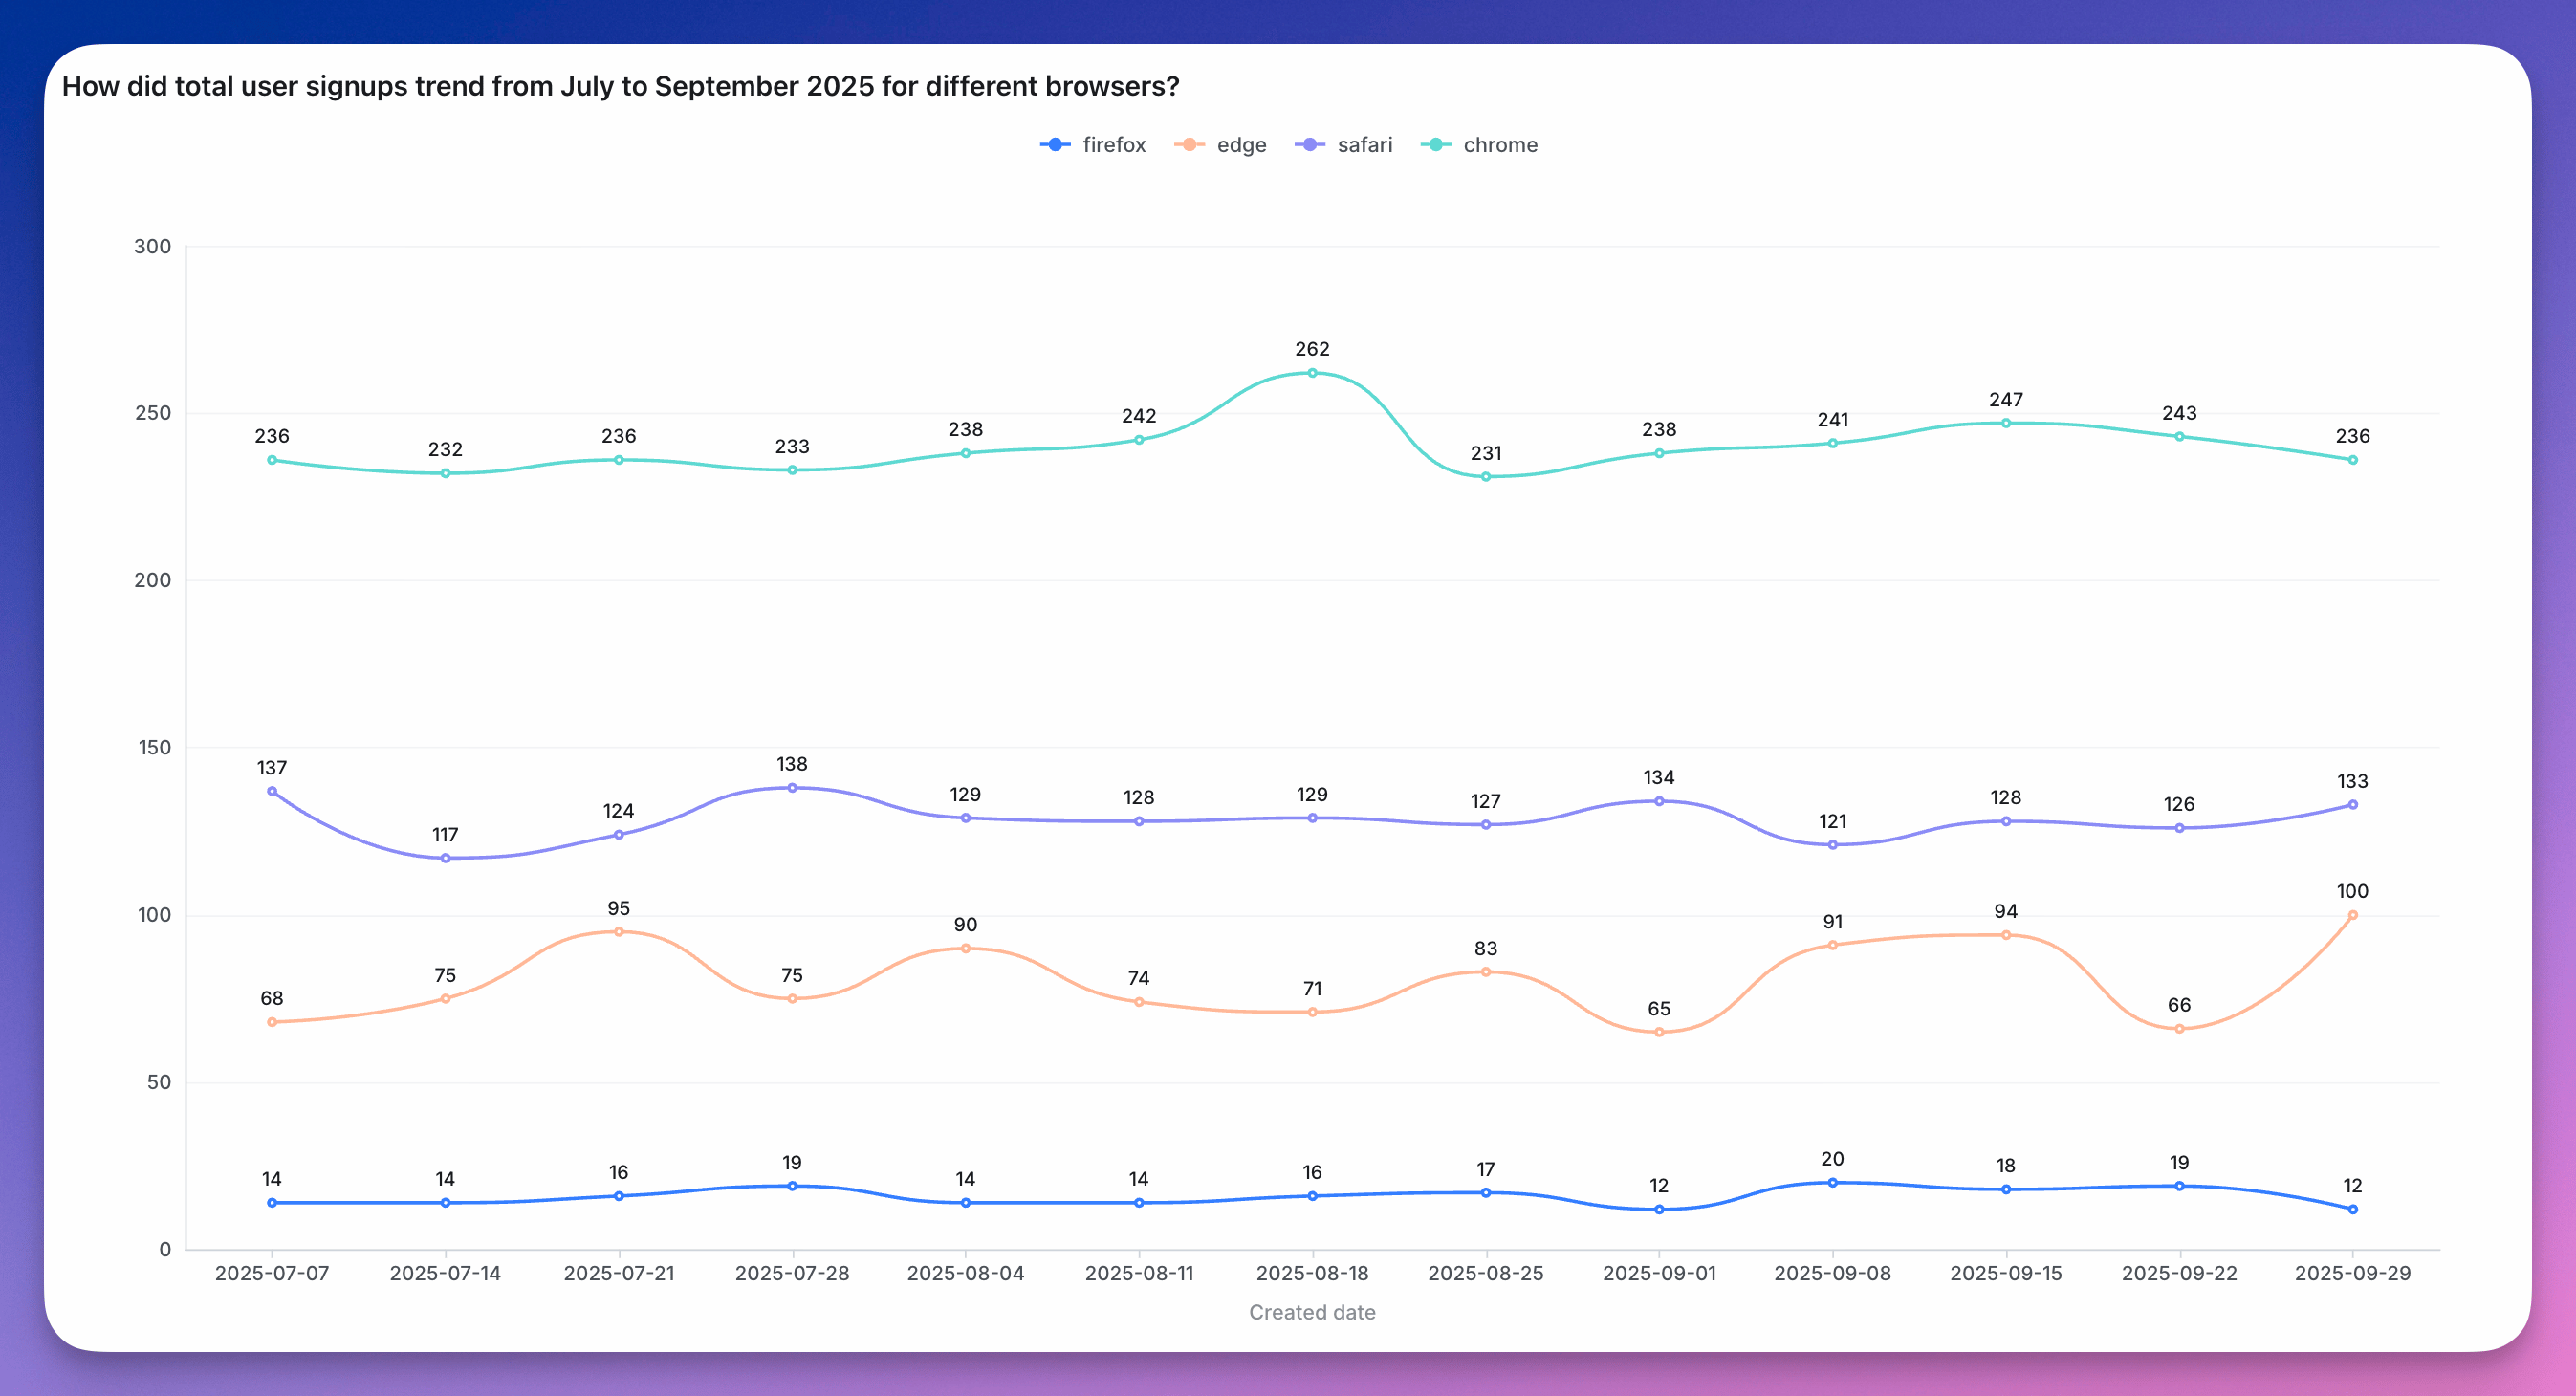
Line charts with multiple lines can also be used to compare changes over the same period of time for more than one group.
Line charts are used to show changes in a number over a short or long period of time.
They're a good option when:
* **you have small changes between your values**. The y-axis of a line chart doesn't need to start at zero. This means that your y-axis can be stretched to show the tiny differences.
* **you have lots of x-axis values**. In this case, line charts are better to use than bar charts.
Line charts with multiple lines can also be used to compare changes over the same period of time for more than one group.
 You can see more details about line chart configurations [here](/guides/configure-charts).