How date zoom works
When viewing a dashboard, click the Date Zoom dropdown to select a granularity (Day, Week, Month, Quarter, Year). All charts with date dimensions will update to show data at that granularity.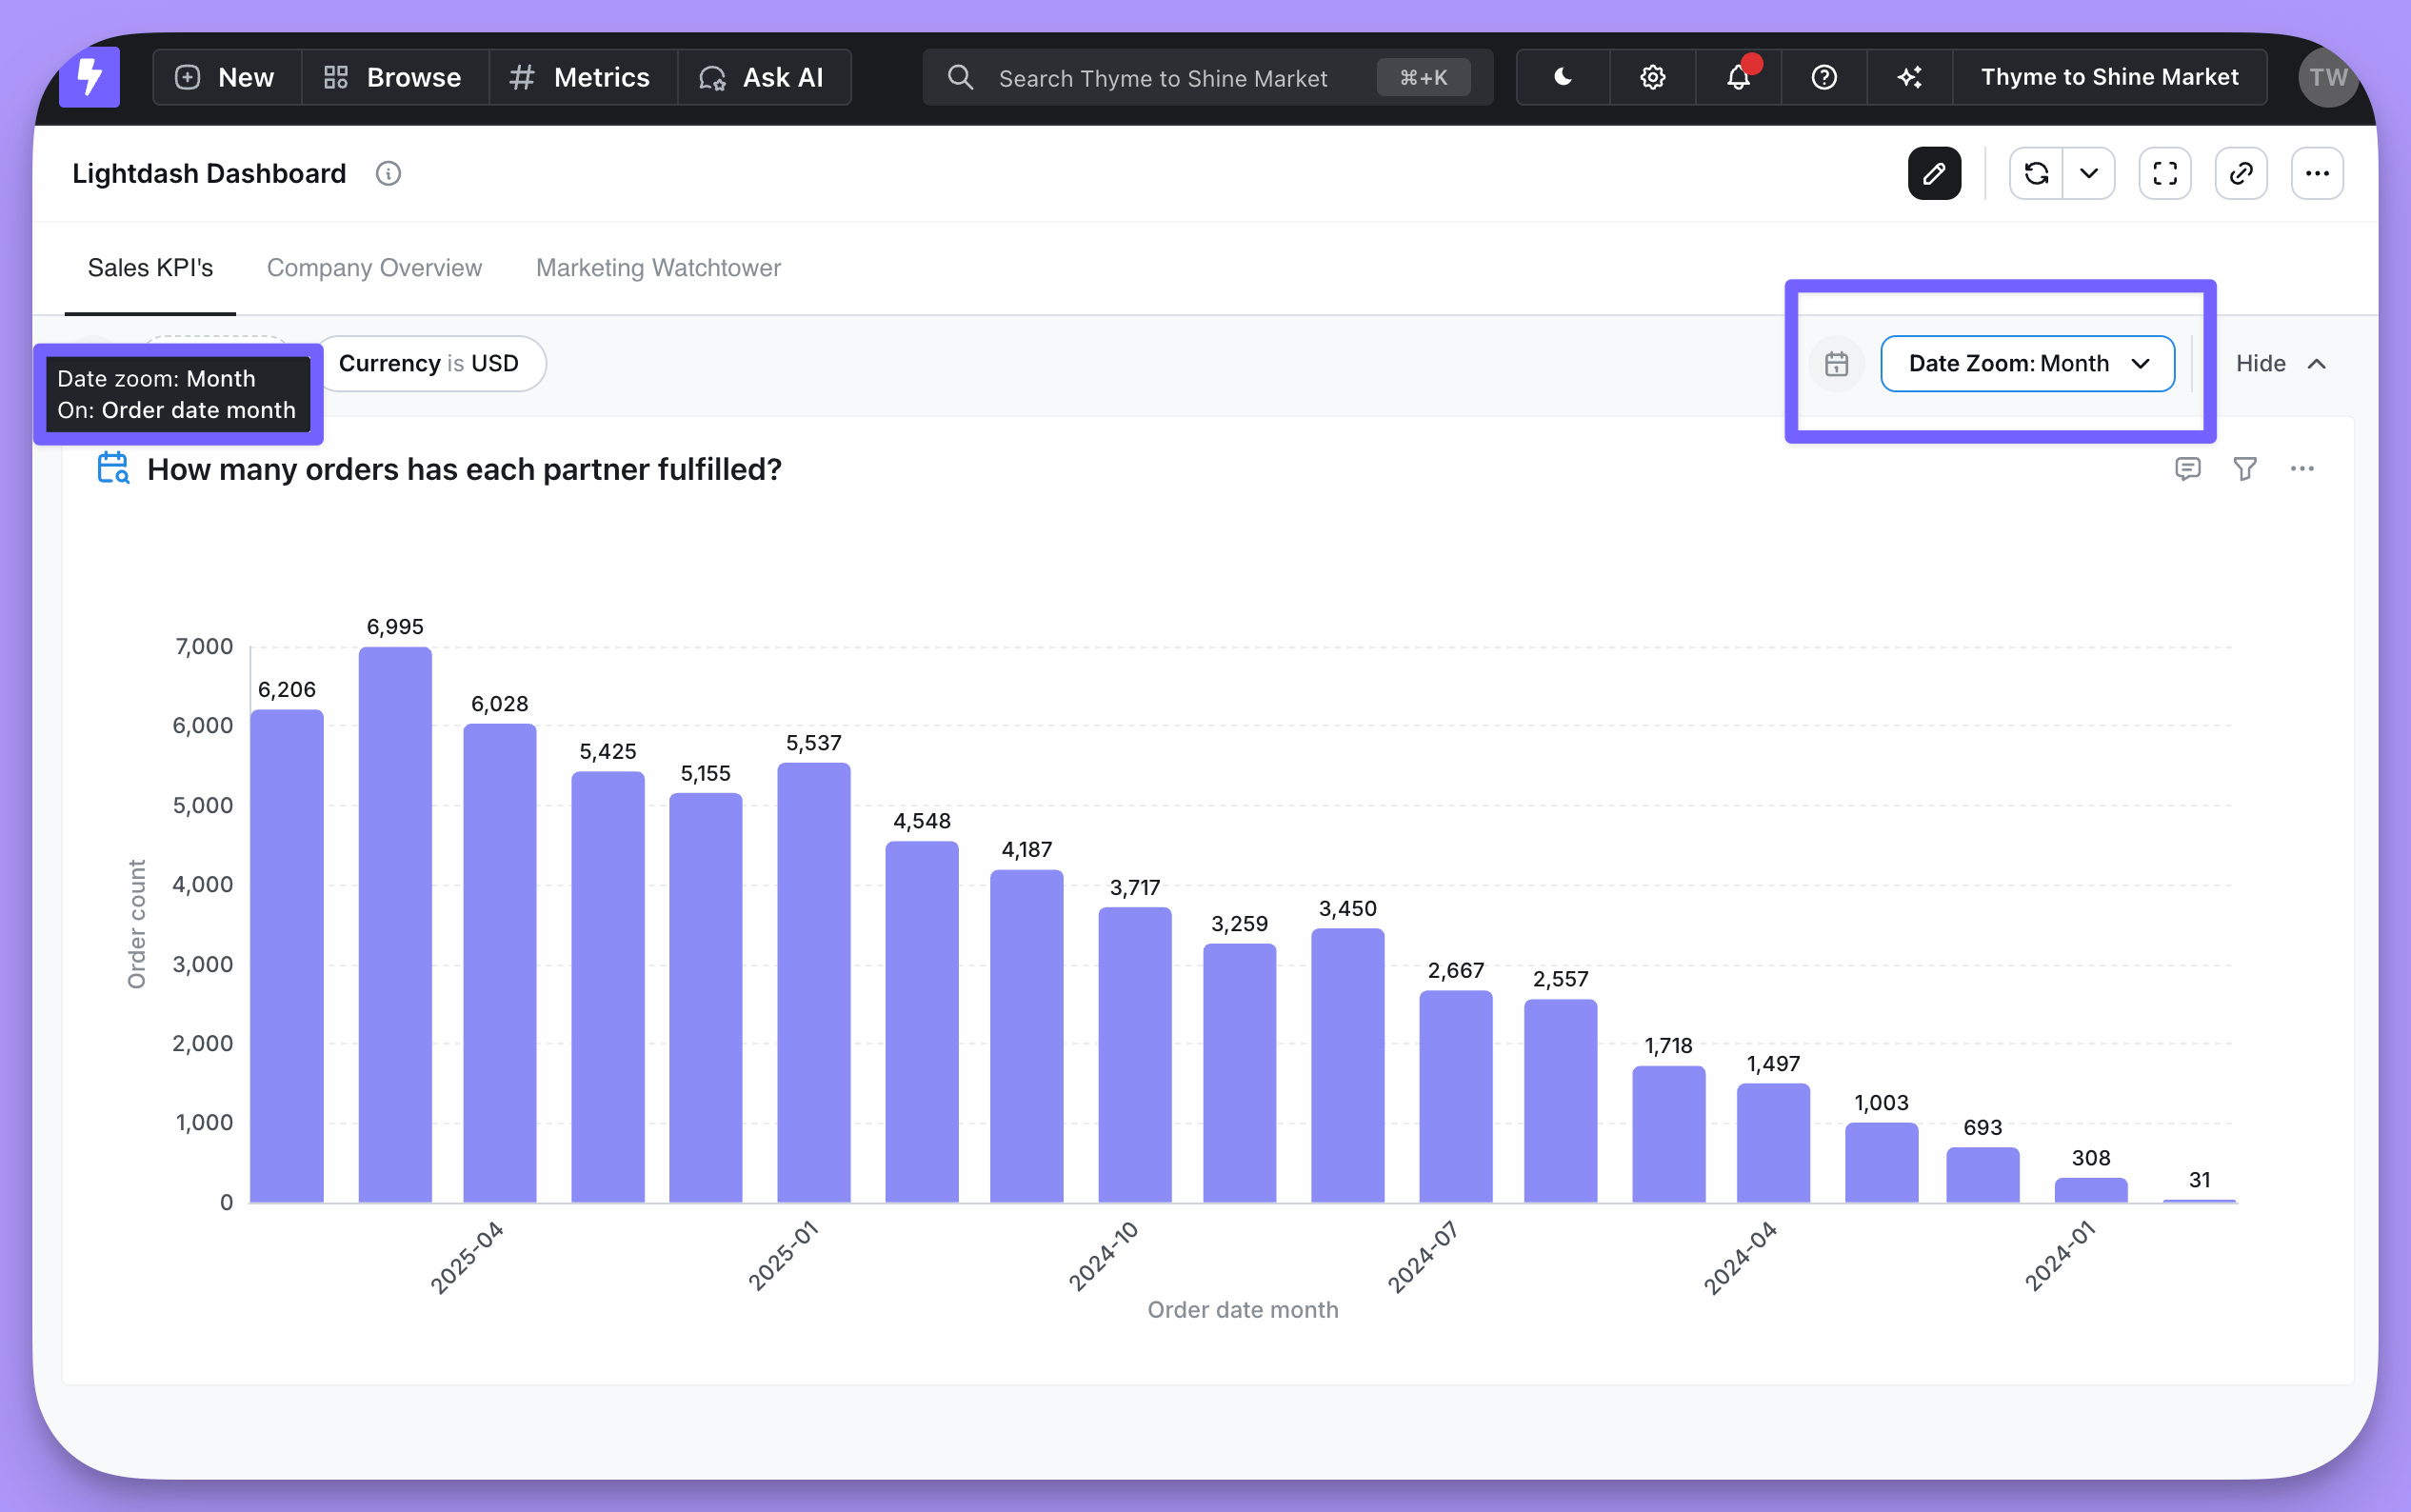
- Applies to charts with at least one date dimension in the results
- If a chart has multiple date dimensions, date zoom uses the first (left-most) dimension
- Changes are temporary—refreshing the dashboard restores the original granularity
- You can see which dimension was affected by hovering over the indicator on each tile
Configuring available granularities
Dashboard editors can customize which granularities appear in the date zoom dropdown and set a default.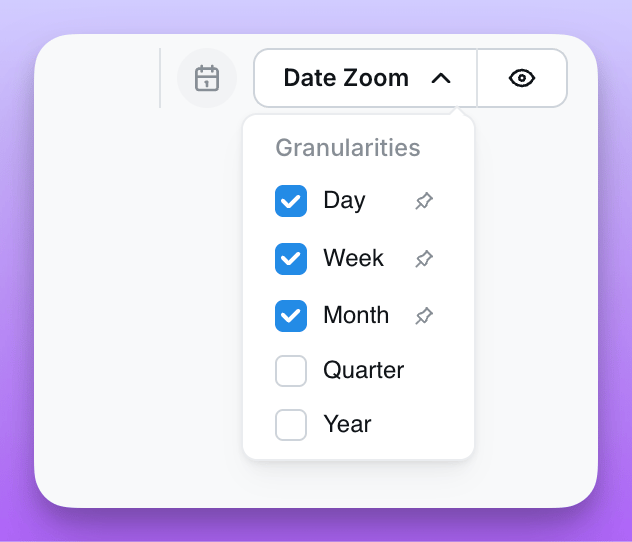
Setting available granularities
- Open the dashboard in edit mode
- Click the Date Zoom dropdown
- Click the pencil icon to enter edit mode
- Use the checkboxes to enable or disable granularities
- At least one granularity must remain enabled
- Save the dashboard to persist your changes
Setting a default granularity
You can pin a granularity as the default that’s automatically applied when the dashboard loads:- In date zoom edit mode, click the pin icon next to a granularity
- The pinned granularity becomes the default
- Click the pin again to remove the default
Default granularities don’t apply when the dashboard is loaded with a granularity already specified in the URL.
Using custom granularities
Custom granularities defined in yourlightdash.config.yml appear in the date zoom dropdown alongside standard options, below a visual divider. This is useful for business-specific time periods like fiscal quarters or custom week definitions.
See the dimensions reference for how to create and configure custom granularities.
Hiding or showing date zoom on a dashboard
You can toggle the visibility of the date zoom control on a dashboard:- Open the dashboard in edit mode
- Click the eye icon next to the Date Zoom dropdown to hide or show it
- Save the dashboard
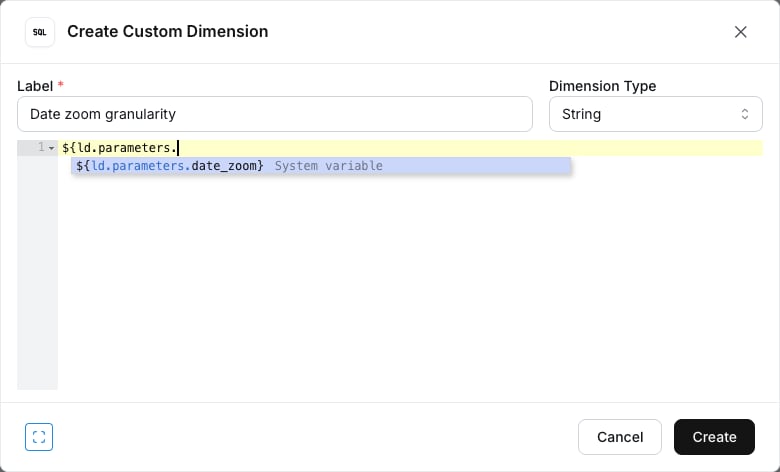
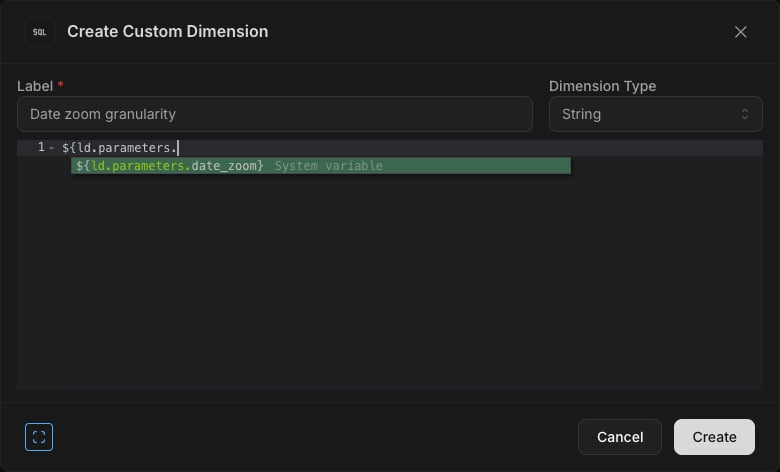
Referencing the date zoom in custom SQL
The currently selected date zoom granularity is exposed as a built-in reserved parameter calleddate_zoom. You can reference it in custom SQL anywhere parameters are supported:
day, week, month, quarter, year, or a custom granularity name). When no date zoom is selected, the value is an empty string.
Referencing the granularity in chart labels
You can also reference the active granularity directly in chart labels — useful for axis names, series names and slice labels that should update when a viewer changes the date zoom (or when a chart is saved at a fixed granularity). Use the following placeholder in any supported label, wheretable_field is the base date dimension on the chart (for example orders_order_date):
day, week, month, quarter, year, or a custom granularity label.
For example, a y-axis label of Orders per ${orders_order_date.granularity} renders as Orders per week when the dashboard is zoomed to a weekly granularity.
When you type
$ in an axis name, big-value label, or gauge label, autocomplete lists every base date dimension on the chart so you can insert the placeholder without remembering the exact field id.You don’t need to remember the exact field id — Lightdash will insert the placeholder for you:- Cartesian axis names, big-value labels, and gauge labels — type
$in the label field and autocomplete lists every base date dimension on the chart. - Pie group labels and funnel step labels — click the insert date granularity icon inside the editable label field to insert the placeholder for the matching date dimension.
- Big value — label and comparison label
- Bar, line, area, scatter, and mixed charts — x-axis name, y-axis name, and series names
- Pie chart — group labels
- Gauge — custom value label and custom percentage label
- Funnel chart — step labels
Date zoom in embedded dashboards
Date zoom can be enabled or disabled in embedded dashboards using thecanDateZoom option in your JWT token:
Related
Custom granularities
Define business-specific time periods
Interactive dashboards
Cross-filtering, drill into, and more
Dimensions reference
Configure time intervals on dimensions
Embedding reference
Embed dashboards with date zoom